Dashboard and analytics
Understand usage snapshots, campaign reports, funnels, journeys, acquisition, and attribution.
Appice InsightsAnalytics · Funnels · Attribution
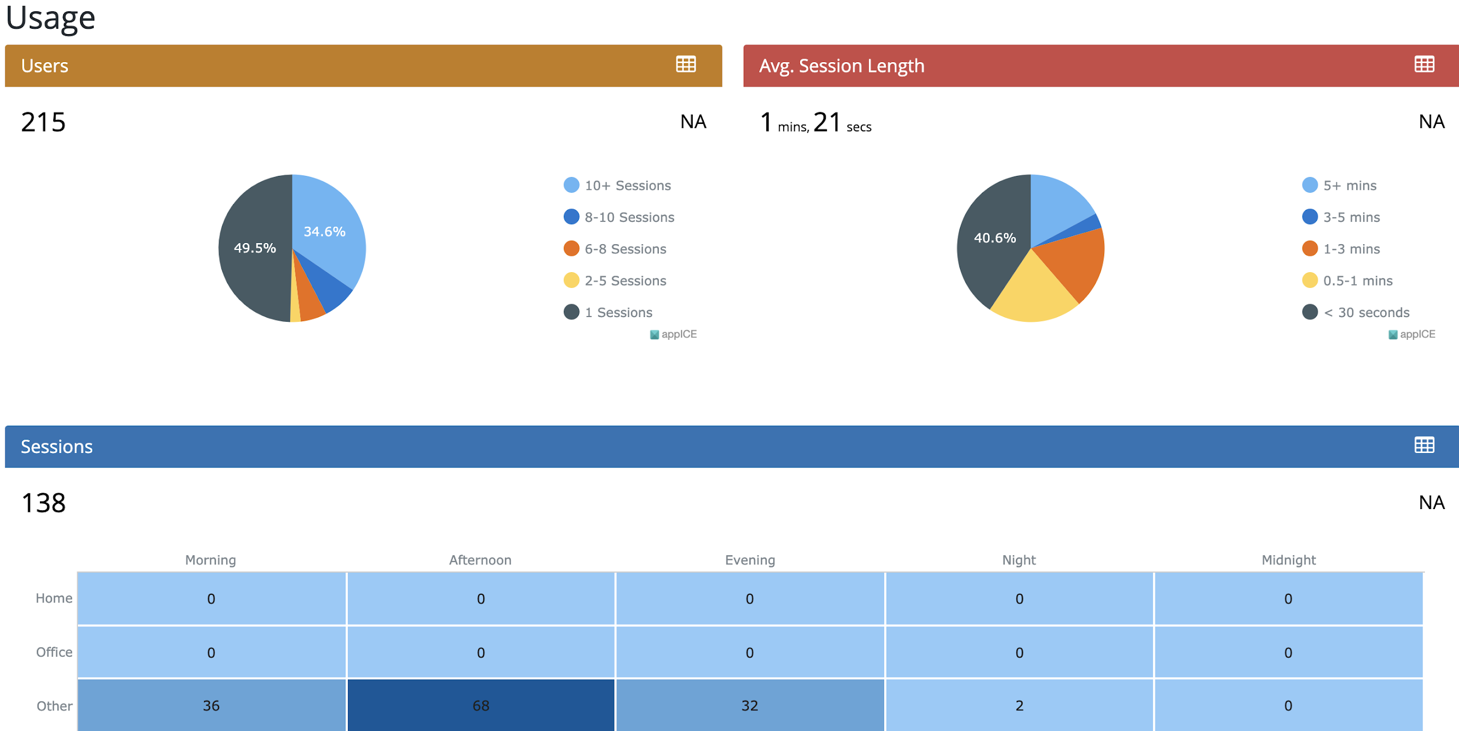
Dashboard overview
The dashboard is the main operating summary for usage and engagement. The manual groups it into a header with platform and time filters, user analytics, user trends, and top events.
User analytics
User analytics focuses on new users, retained users, and engagement. These metrics help teams track acquisition, active base size, and session activity over the chosen period.
- New Users show installations or first visits in the selected period.
- Retained Users represent active users who continue using the app.
- Engagement shows the volume of sessions and campaign interaction context.
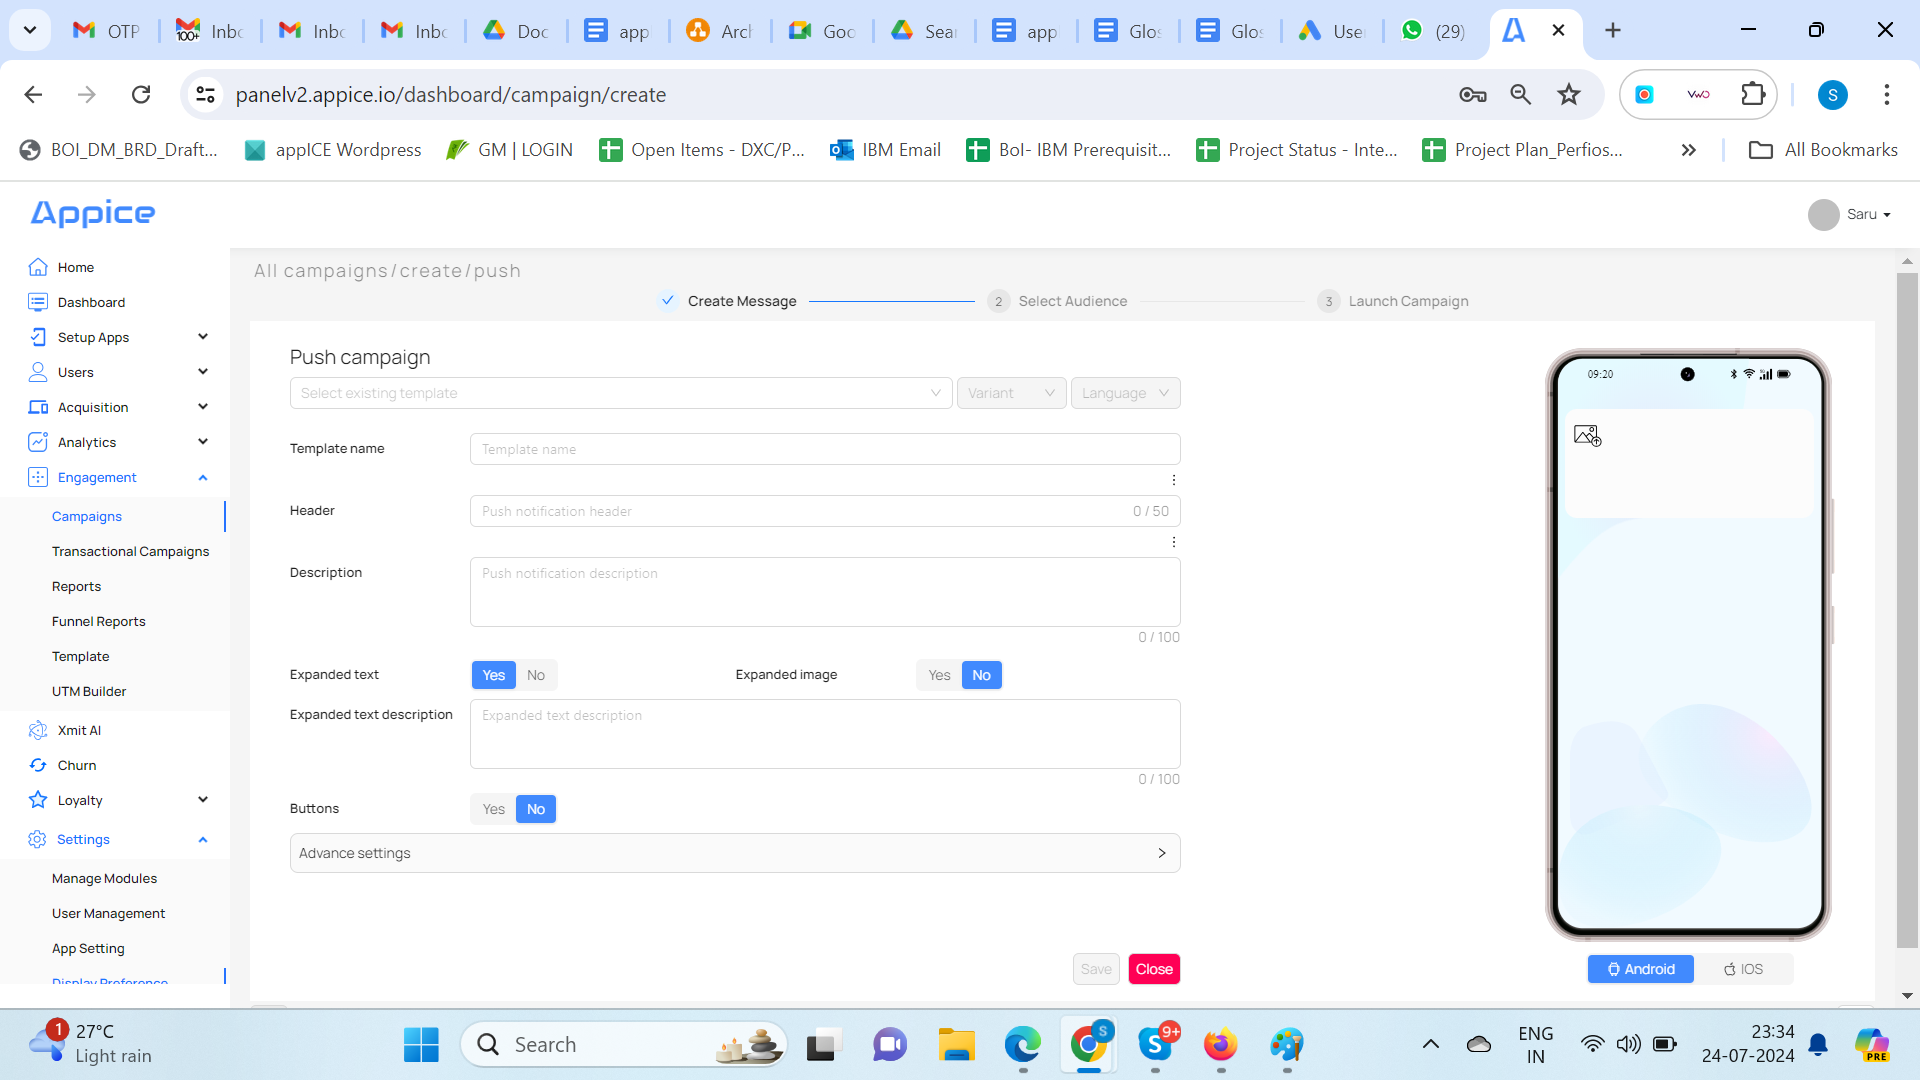
Reports and campaign metrics
Appice includes campaign reports and channel-level analytics for push, in-app, email, SMS, and WhatsApp, subject to callback support from the connected provider. Metrics in the manual include reachable audience, sent, delivered, opened, clicked, CTR, bounce rate, unsubscribe rate, and more.
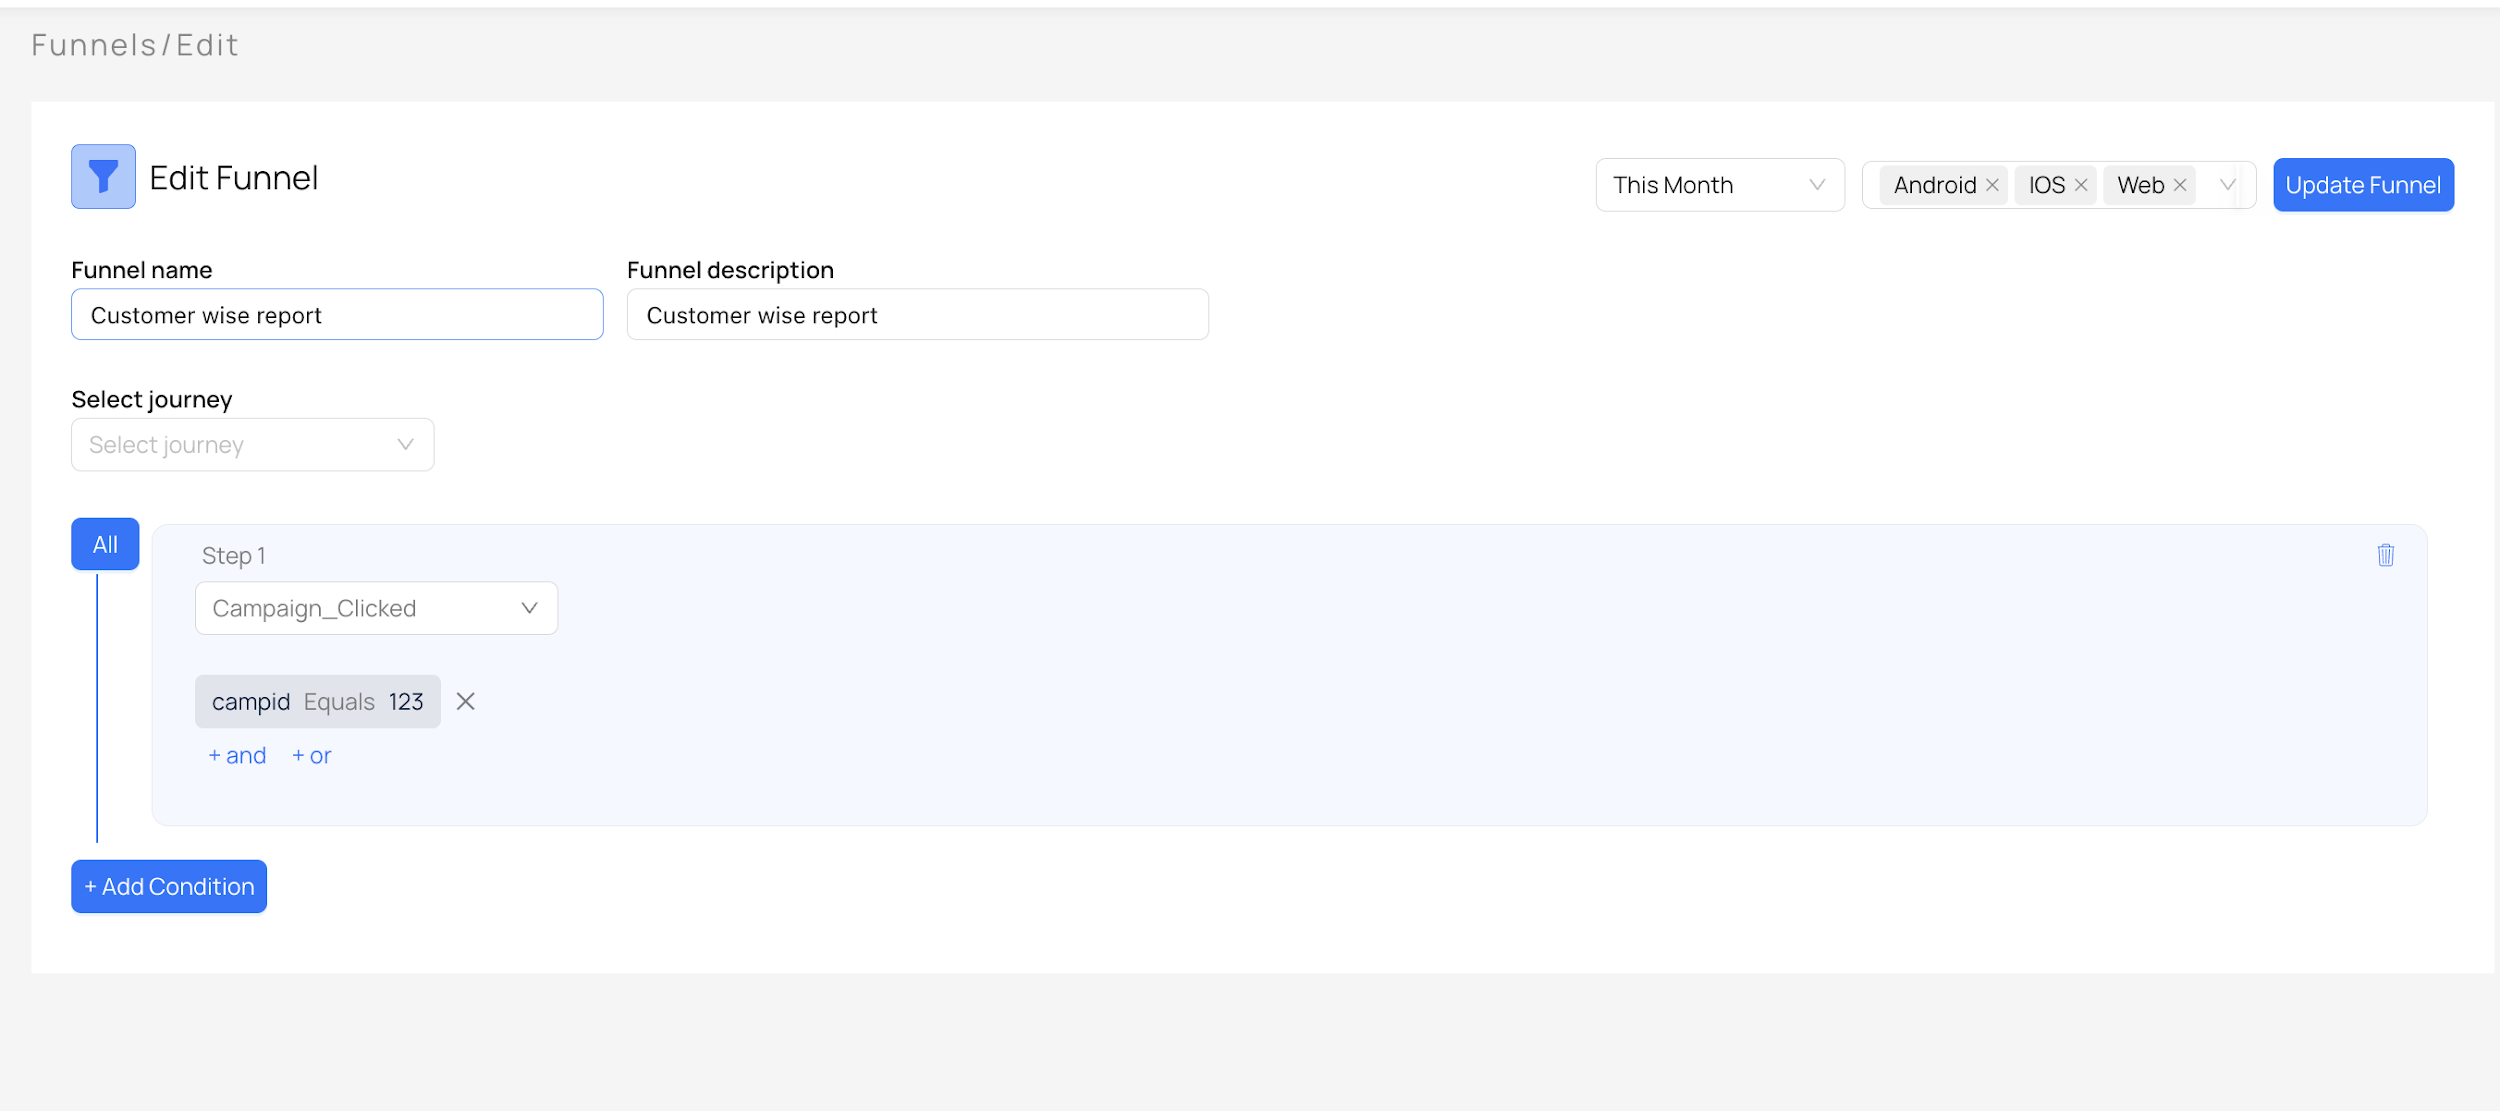
Funnels and journeys
Funnels show where users drop off in a defined sequence of events. Journeys extend that understanding by visualizing how users move across screens or actions. Together they help product and marketing teams understand where customers abandon or convert.
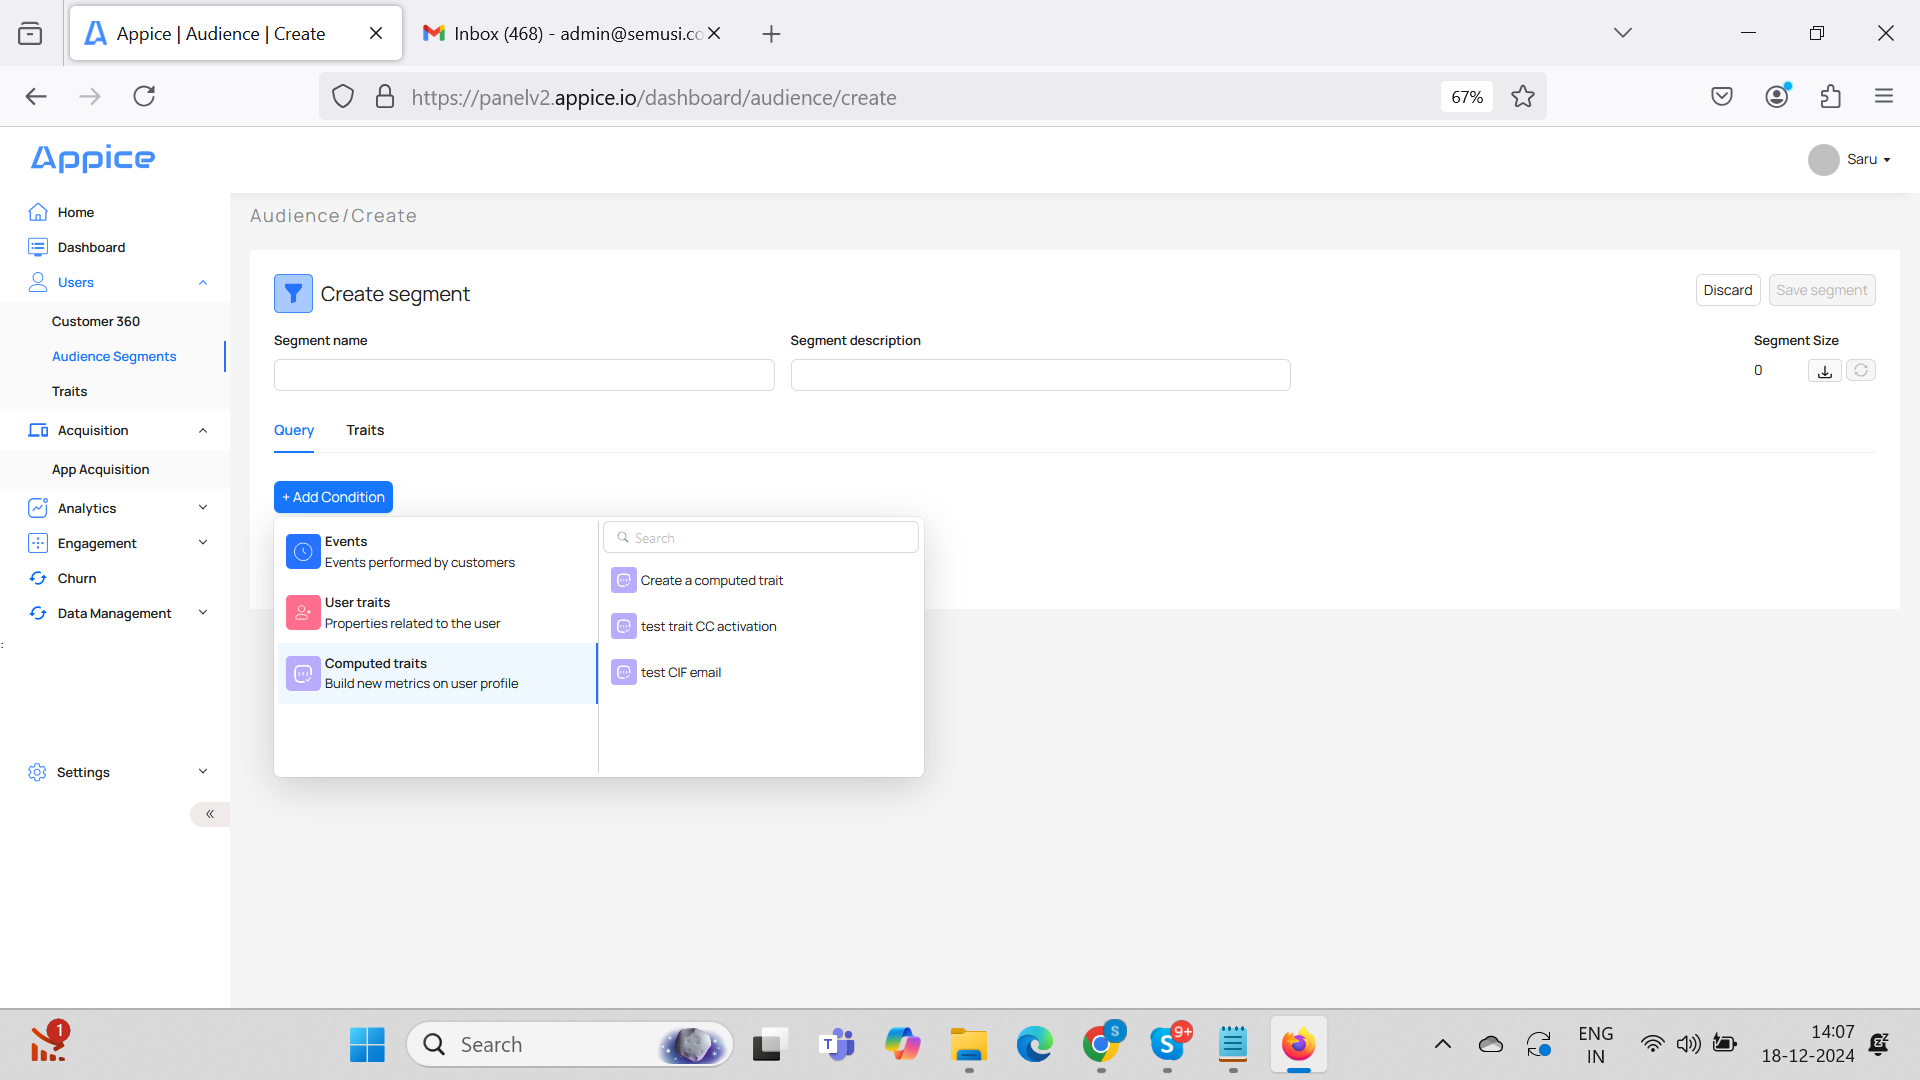
Typical funnel examples include registration, deposit creation, or product application flows. Once drop-offs are identified, audiences can be created and recovery campaigns can be launched.
Acquisition and attribution
The manual also covers acquisition sources, app versions, locations, OS, time-wise and day-wise acquisition, and third-party attribution integration. This is important when teams need to understand where users come from and which channels deserve more budget.
For the live site, consider splitting acquisition and attribution into their own article once the docs grow beyond the current first release.